 Isaiminia World Breaking News & Top Stories
If you have been thinking about diversifying your investments to spread out your risk in an increasingly turbulent market, then gold is the way to go. Gold, which you can buy as coins or bars, is one of the safest assets you can buy. It’s rare, tangible, and, more importantly, stable.
That said, gold is not just a store of value. You can make decent returns by becoming a gold trader. Basically, you buy and sell gold periodically to make profits.
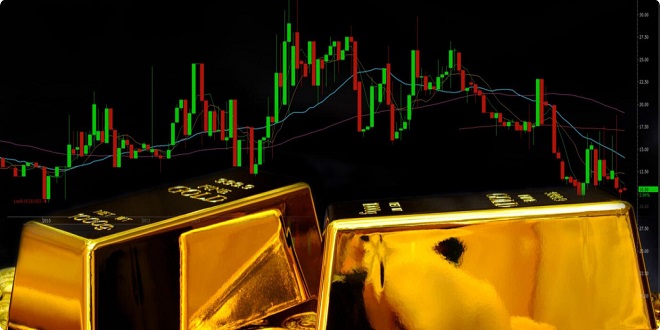
Either way, knowing how to read a gold spot price is a fundamental skill. That’s because this chart tells you exactly how your investment is doing at any given time. So, here is what you need to know to sharpen your chart reading skills:
How Gold is Typically Priced
Before reading a chart, you want to check how much gold the price represents to ensure you interpret the data correctly. Most charts price gold using three weight measurements: ounce, kilo, or gram. You can switch to whichever metric you prefer. Remember, the price, usually in dollars, is on the vertical axis.
Timeframes on the Price Chart
By default, gold spot price charts show you the price of metal in real-time. And, it changes by the minute. But that is not to say it is the only information on the chart. Traders often want to know how the asset performed in the last hour, day, week, month, or even year. That’s because longer price data assessments can help uncover patterns and possibly predict future price movements.
So, you can specify your own timeline to zoom in on smaller fluctuations or zoom out on larger changes. Time is on the horizontal axis of the chart.
Reading Gold Prices at Precise Times
Now, once you have selected a timeframe you want to analyze, you only need to hover your cursor over the graph to see precise spot prices for specific times. The typical information displayed includes date, time, and price.
Interpreting Price Patterns and Trends
The key purpose of reading price charts is to analyze price levels, patterns, and trends to draw insights from them. This is known as technical analysis. As a beginner, one of the key things you want to check for is support and resistance.
Support is where a downward trend is expected to pause and eventually reverse. Downward trends happen when supply is greater than demand. The demand starts to overwhelm supply at the support level, pushing the price upwards.
On the other hand, resistance is where an upward trend stops and starts to dip. It is the point where selling exceeds investors’ desire to buy, thereby pushing the price down.
You can spot support or resistance by looking at a significant pause on the chart and whether it is followed by a reversal. After that, move forward and see whether the price pauses when it reaches the threshold again. If this checks out, you have found your support or resistance and can determine when to buy or sell more accurately.
Now, shorter timeframes still work, but longer time frames tend to provide more accurate support and resistance readings.
Use These Basic Tips to Make Better Gold Spot Price Chart Readings
Reading gold charts can look complex. However, you don’t need to know everything to make sense of them. These pointers should help you get started. And, with time, you can explore more technical bits.